


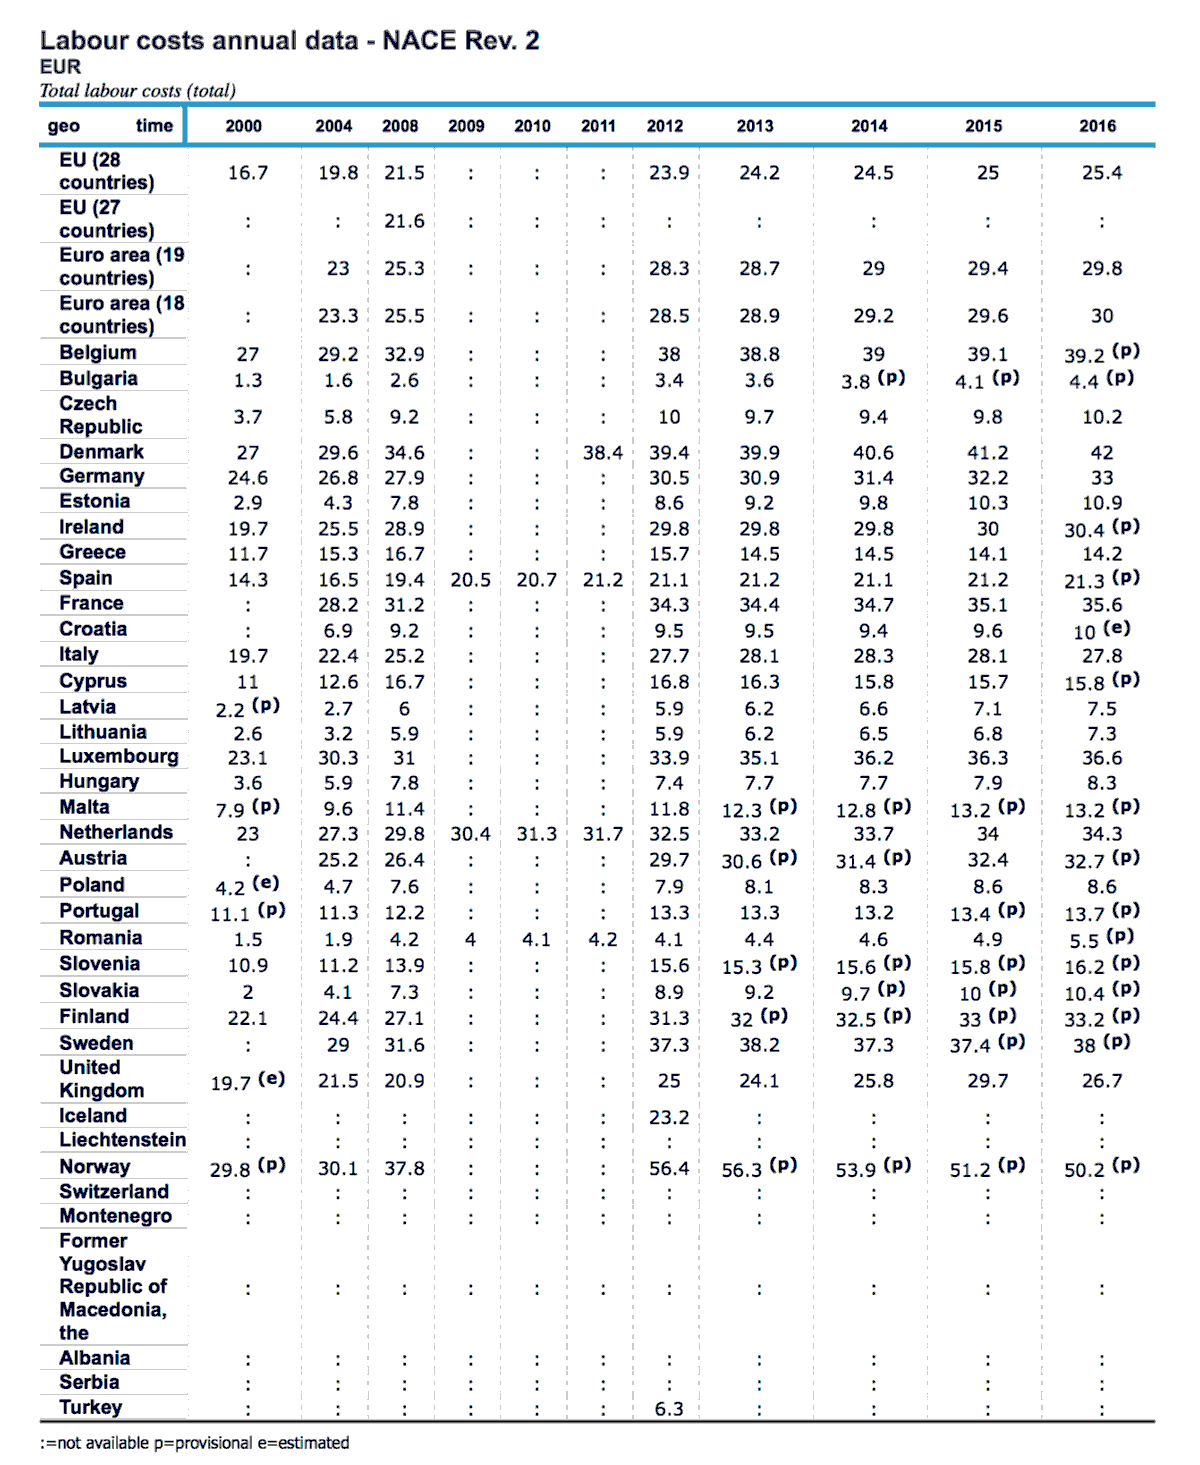
Eurostat data on total average hourly labor costs.
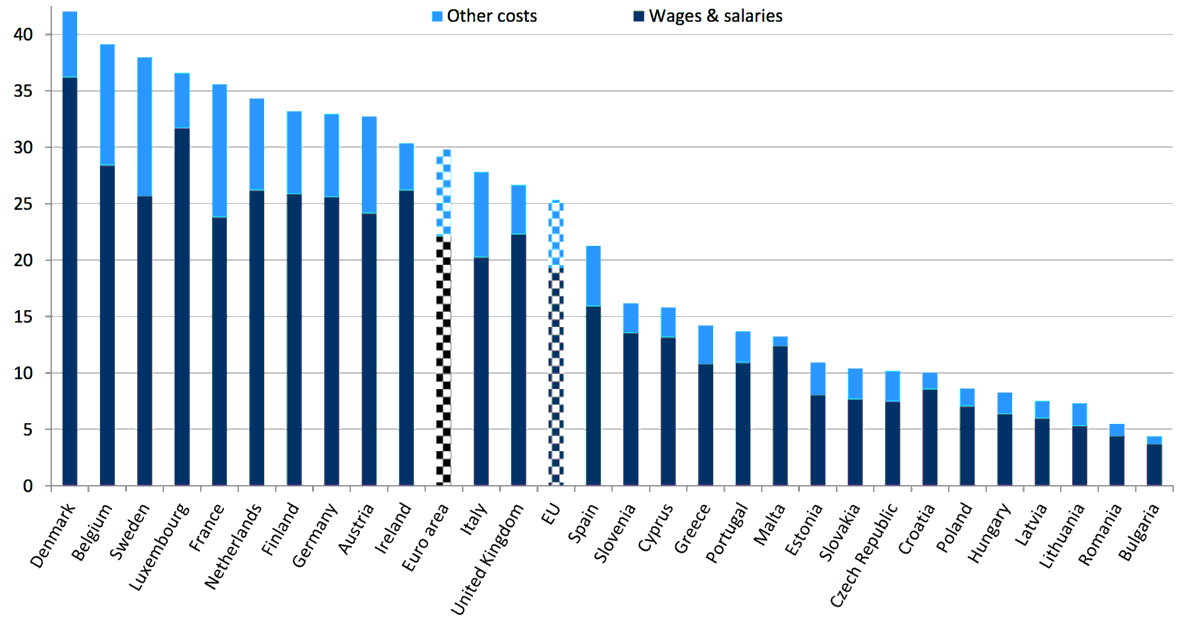
Total labour costs
Total labor costs cover wages and non-wage costs (employers' social contributions plus taxes minus subsidies).
Social contributions and other labour costs
Employers' social contributions and other labour costs paid by employer.
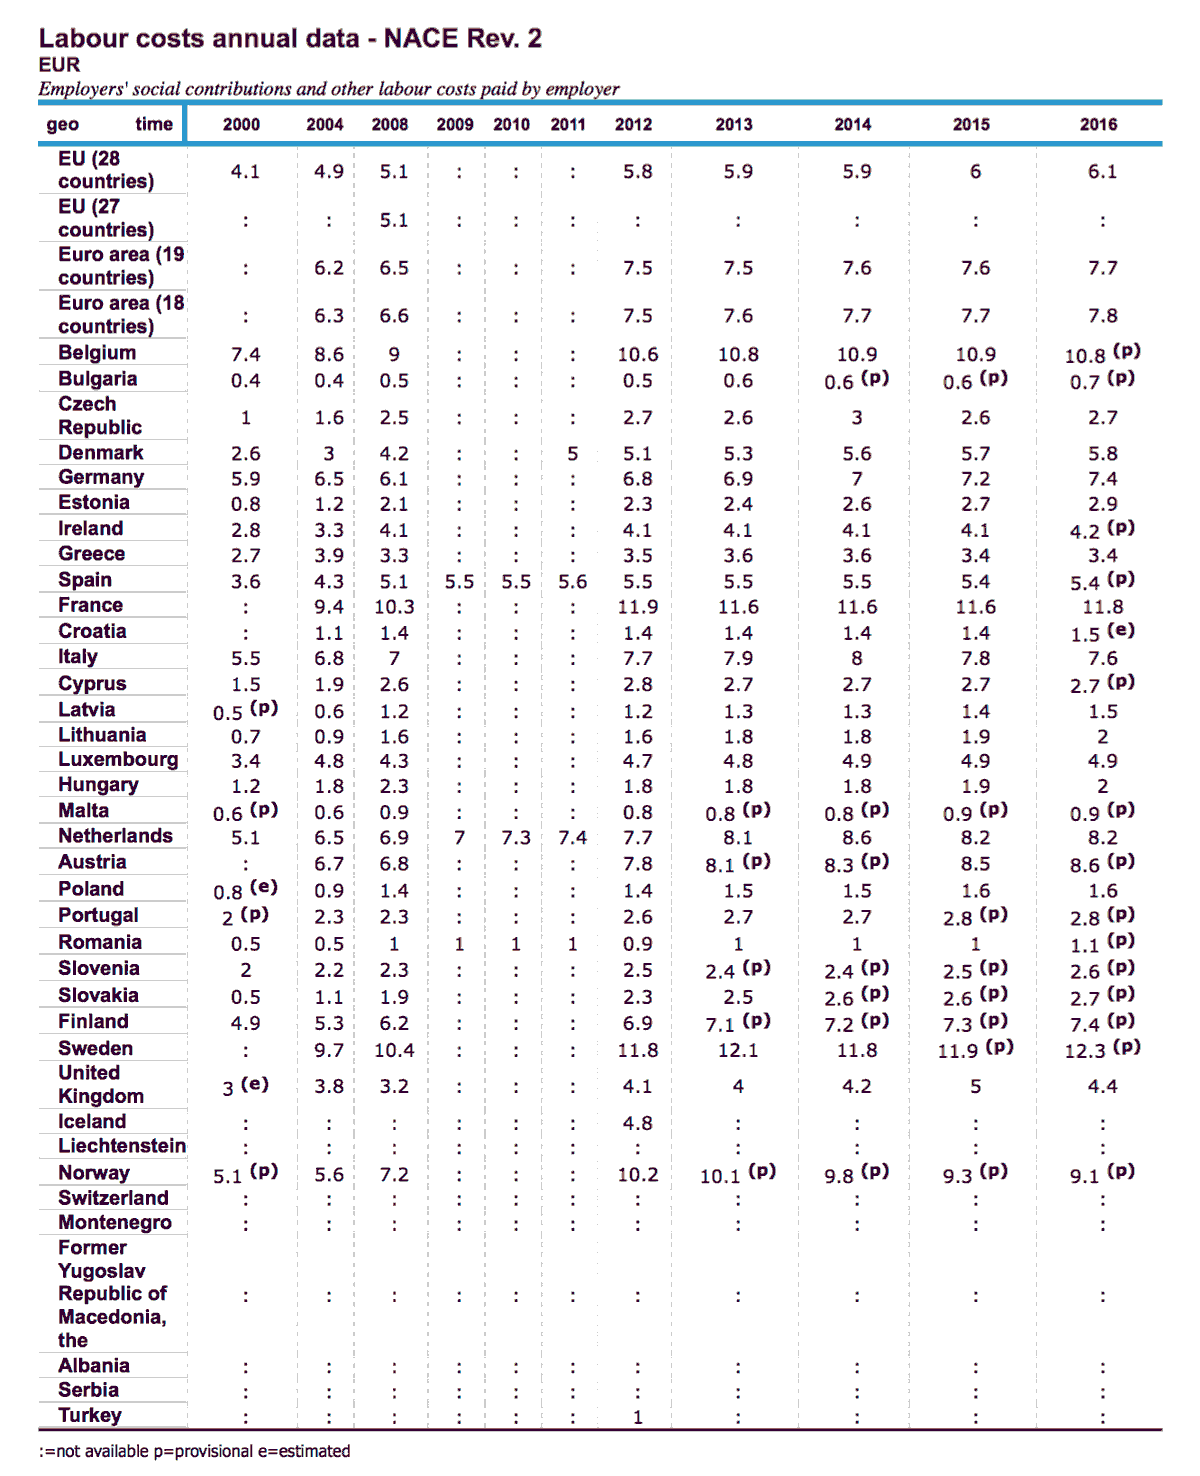
Eurostat - Employers' social contributions and other labour costs paid by employer
Note:
I do not know the components of the employers' share in other EU countries but, in France, the employers' share includes health insurance, pension insurance and certain other social benefits which are at the base of social welfare.
The lowest wages
Extract of Eurostat press release 58/2017 from 6 April 2017 :
"Hourly labour costs ranged from €4.4 to €42.0 across the EU Member States in 2016.
Lowest in Bulgaria and Romania, highest in Denmark and Belgium."
Earnings disparities
Extrait de Earning Statistics :
"Largest earnings disparities in Poland, Romania, Cyprus, Portugal, Bulgaria and Ireland.
Across the EU Member States in 2014, the D9/D1 dispersion ratio ranged from 2.1 in Sweden to 4.7 in Poland. This means that the 10% best-paid employees earned at least twice as much as the 10% lowest-paid in Sweden, and nearly five times as much in Poland. After Poland, Romania (with a ratio of 4.6), Cyprus (4.5), Portugal (4.3), Bulgaria (4.2) and Ireland (4.1) registered high disparities in gross hourly earnings. In contrast, the lowest D9/D1 ratios were recorded, after Sweden, in Belgium, Denmark and Finland (all with a ratio of 2.4), France (2.7) and Malta (2.9). (Figure 4)"